- UCLA is a -15.5 point favorite vs. New Mexico
- New Mexico vs. UCLA Total (Over/Under): 52.5 points
- TV Channel: BTN
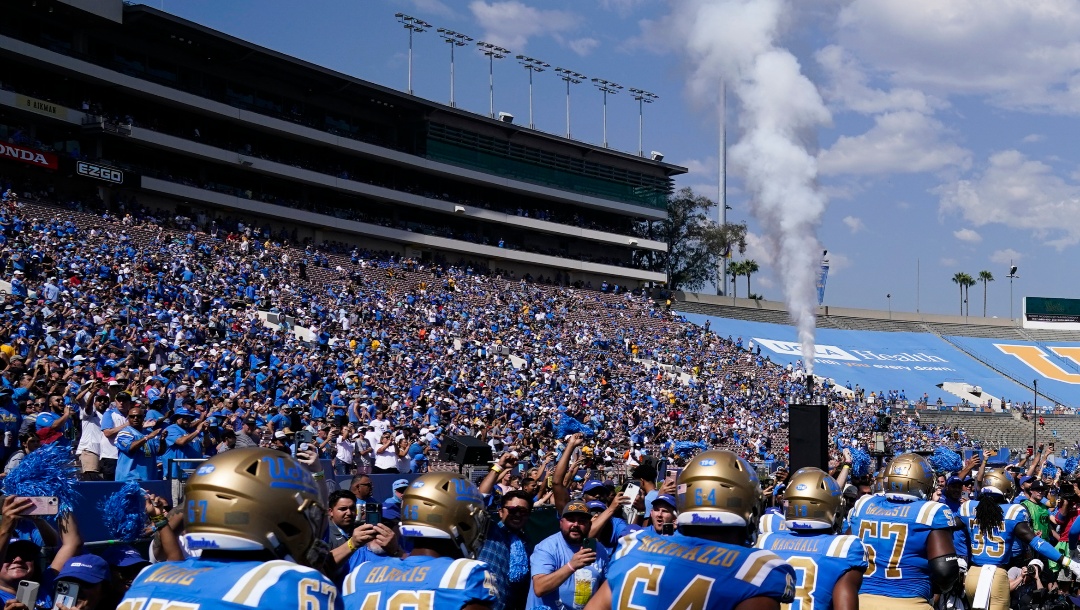
New Mexico (1-1) visit Rose Bowl to take on UCLA (0-2) on Sep. 12 in Pasadena, CA. Kickoff is scheduled for 10:00pm EDT.
UCLA is a betting favorite in Week 3, with the spread sitting at -15.5 (-110).
The New Mexico vs. UCLA Over/Under is 52.5 total points.
Bet now on UCLA vs New Mexico & all NCAAF games with BetMGM
New Mexico vs. UCLA Odds, Spread, Over/Under:
| Spread | Total (O/U) | Moneyline | |
| New Mexico | ++15.5 -110 | 52.5 -105 | 450 |
| UCLA | -15.5 -110 | 52.5 -115 | -625 |
New Mexico vs UCLA Prediction:
The winning team model predicts UCLA will win this game with 79.0% confidence, based on game simulations, offensive & defensive matchups and recent game results.
This winning team prediction factors in up-to-date player injuries for both New Mexico and UCLA, key player performances this season and recent team trends.
New Mexico vs UCLA Spread Prediction:
Based on recent against-the-spread trends, the model predicts UCLA will cover the spread with 73.4% confidence.
This prediction against the spread factors in ATS performances for both teams, opening and current betting lines plus public and sharp money already wagered on this matchup.
Bet now on UCLA vs New Mexico and all games with BetMGM
New Mexico Best Bets Today
- New Mexico has hit the Game Total Over in 8 of their last 12 games (+3.60 Units / 27% ROI)
- New Mexico has hit the 1H Game Total Under in 4 of their last 7 away games (+1.75 Units / 22% ROI)
- New Mexico have covered the Spread in 4 of their last 7 away games (+0.70 Units / 9% ROI)
- New Mexico have covered the 1H Spread in 4 of their last 7 away games (+0.65 Units / 8% ROI)
- New Mexico has hit the 1Q Game Total Over in 4 of their last 7 away games (+0.45 Units / 5% ROI)
UCLA Best Bets Today
- UCLA has hit the Game Total Under in 5 of their last 7 games at home (+2.80 Units / 36% ROI)
- UCLA has hit the 1H Game Total Over in 8 of their last 13 games (+2.30 Units / 16% ROI)
- UCLA has hit the 1Q Moneyline in 4 of their last 9 games (+1.75 Units / 17% ROI)
- UCLA has hit the 1Q Game Total Under in 7 of their last 12 games (+1.50 Units / 10% ROI)
- UCLA have covered the 1Q Spread in 6 of their last 12 games (+0.10 Units / 1% ROI)
New Mexico Against the Spread (ATS) Record
New Mexico is 1-1 against the spread this college football season (-0.1 Units / -4.55% ROI).
- New Mexico is 1-0 when betting on the Moneyline for +1 Units / 11.76% ROI
- New Mexico is 1-1 when betting the Over for -0.1 Units / -4.55% ROI
- New Mexico is 1-1 when betting the Under for -0.1 Units / -4.55% ROI
UCLA Against the Spread (ATS) Record
UCLA iss 0-2 against the spread this college football season (-2.2 Units / -100% ROI).
- UCLA is 0-2 when betting on the Moneyline for -2.3 Units / -100% ROI
- UCLA is 1-1 when betting the Over for -0.1 Units / -4.55% ROI
- UCLA is 1-1 when betting the Under for -0.1 Units / -4.55% ROI
New Mexico: Keys to the Game vs. UCLA
New Mexico is winless (0-2) when averaging less than 5 yards per rush since the 2024 season– T-worst in FBS; Average: .428
New Mexico was winless (0-1) when averaging less than 5 yards per rush last season– T-worst in FBS; Average: .420
New Mexico is winless (0-2) when averaging less than 5 yards per rush since the 2024 season– T-worst among Non-Power Conference Teams; Average: .368
New Mexico was 1-5 (.167) when throwing at least 1 interception last season– T-19th-worst in FBS; Average: .382
UCLA: Keys to the Game vs. New Mexico
UCLA is 2-9 (.182) when not forcing and recovering a fumble since the 2024 season– 3rd-worst among Power Conference Teams; Average: .529
UCLA was 5-2 (.714) when in a one score game last season– 11th-best among Power Conference Teams; Average: .514
UCLA was 2-7 (.222) when not forcing and recovering a fumble last season– T-21st-worst in FBS; Average: .460
UCLA was 3-6 (.333) when allowing 10 or more rushes of four or more yards last season– T-15th-worst among Power Conference Teams; Average: .515
Matchup Notes for New Mexico vs. UCLA
UCLA’s WRs has averaged just 11.9 yards after the catch since the 2024 season — 4th-worst among Big Ten WRs. New Mexico’s defense has allowed 12.8 RAC to TEs since the 2024 season — T-13th-worst among FBS defenses.
UCLA’s WRs has averaged just 11.9 yards after the catch since the 2024 season — 4th-worst among Big Ten WRs. New Mexico’s defense has allowed 13.9 RAC to WRs since the 2024 season — T-21st-worst among FBS defenses.
UCLA’s WRs has averaged just 11.9 yards after the catch since the 2024 season — T-25th-worst among FBS WRs. New Mexico’s defense has allowed 12.7 RAC since the 2024 season — T-18th-worst among FBS defenses.
New Mexico’s QBs has thrown for 363 passing yards in 2 games (just 181.5 YPG) this season — 35th-worst among FBS teams. UCLA’s defense has allowed 204.5 passing yards per game this season — 5th-worst among Big Ten defenses.
New Mexico’s TEs has gained 274 yards on 40 receptions (just 6.8 YPR) since the 2024 season — 3rd-worst among FBS TEs. UCLA’s defense has allowed just 11.0 Yards Per Reception since the 2024 season — T-30th-best among FBS defenses.
New Mexico’s RBs has rushed for 2,084 yards on 331 carries (6.3 YPC) since the 2024 season — T-6th-best among FBS RBs. UCLA’s defense have allowed just 3.7 YPC since the 2024 season — T-33rd-best among FBS defenses.
New Mexico Offensive Stats & Trends
New Mexico TEs have averaged 12.0 receptions per game (12/1) this season– best among FBS Teams; Average: 3.4
New Mexico TEs have been targeted 5 times in the Red Zone this season– 2nd-most among FBS Teams
New Mexico’s QBs has thrown for 363 passing yards in 2 games (just 181.5 YPG) this season — 35th-worst among FBS teams. UCLA’s defense has allowed 204.5 passing yards per game this season — 5th-worst among Big Ten defenses.
New Mexico TEs have been targeted 16.0 times per game (16/1) this season– T-highest among FBS Teams; Average: 5.2
New Mexico RBs have been targeted 13.0 times per game (13/1) this season– highest among FBS Teams; Average: 4.3
UCLA Offensive Stats & Trends
UCLA TEs averaged 18.7 yards per reception (431 yards/23 catches) in the 2023 season– best among Big Ten Teams; Average: 10.9
UCLA’s WRs has averaged just 11.9 yards after the catch since the 2024 season — 4th-worst among Big Ten WRs. New Mexico’s defense has allowed 12.8 RAC to TEs since the 2024 season — T-13th-worst among FBS defenses.
UCLA’s WRs has averaged just 11.9 yards after the catch since the 2024 season — 4th-worst among Big Ten WRs. New Mexico’s defense has allowed 13.9 RAC to WRs since the 2024 season — T-21st-worst among FBS defenses.
UCLA RBs rushed for 3 TDs on 45 carries (15 Carries Per TD) in the Red Zone last season– 4th-worst Carries Per TD among FBS Teams; Average: 4.5
UCLA’s WRs has averaged just 11.9 yards after the catch since the 2024 season — T-25th-worst among FBS WRs. New Mexico’s defense has allowed 12.7 RAC since the 2024 season — T-18th-worst among FBS defenses.
New Mexico Defensive Stats & Trends
New Mexico allowed 10.0 touchdowns per interception (30 TDs allowed, and 3 INT) last season– worst in FBS; Average: 1.8
New Mexico allowed 10.0 touchdowns per interception (30 TDs allowed, and 3 INT) last season– worst among Non-Power Conference Teams; Average: 2.0
New Mexico intercepted 3 of 395 attempts (131.7 pass attempts per int.) last season– 2nd-worst in FBS; Average: 36.1
New Mexico intercepted 3 of 395 attempts (131.7 pass attempts per int.) last season– 2nd-worst among Non-Power Conference Teams; Average: 37.9
New Mexico averaged a sack every 35.9 pass attempts (395 Pass Attempts/11 Sacks) last season– 2nd-worst in FBS; Average: 14.5
UCLA Defensive Stats & Trends
UCLA has allowed 54.0 carries per game (54 carries / 1 games) this season– highest in the Big Ten; Average: 30.2
UCLA has allowed a Completion Pct of 84% (21 completions/25 attempts) this season– worst among Power Conference Teams; Average: 58%
UCLA has allowed 6 TDs in the Red Zone this season– most among Power Conference Teams
UCLA has allowed a Completion Pct of 84% (21 completions/25 attempts) this season– worst in the Big Ten; Average: 59%
UCLA has allowed 4 rushing TDs this season– T-2nd-most among Power Conference Teams
Bet now on UCLA vs New Mexico and all games with BetMGM
More College Football Betting at BetMGM
BetMGM is the best online sportsbook for college football betting.
Whether you’re a first-time bettor checking out the best sportsbook promos, a casual fan betting on Georgia football national championship odds, Michigan football odds, or Ohio State playoff odds, or a longtime diehard breaking down trends for live sports betting, there are entertainment options for everyone.
Visit the sportsbook today to place a college football bet online!
The content provided in this blog is intended for entertainment purposes only. All views and opinions expressed are the authors and reflect their individual perspectives on sports, betting, and related topics. This content should not be considered professional betting advice or the official views of BetMGM LLC. Please gamble responsibly. If you or someone you know is experiencing issues related to gambling, seek help from a licensed health professional. This blog is not liable for any losses, damages, or consequences resulting from betting activities.