- UNLV is a -3 point favorite vs. Hawaii
- Hawaii vs. UNLV Total (Over/Under): 64.5 points
- TV Channel: FS1
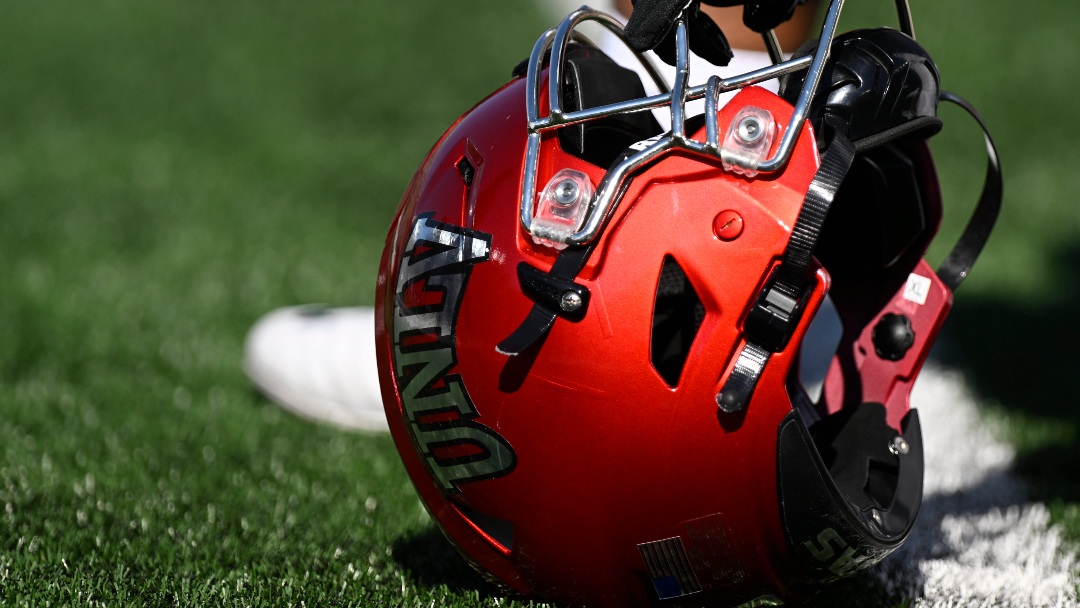
Hawaii (7-3) visit Allegiant Stadium to take on UNLV (8-2) on Nov. 21 in Paradise, NV. Kickoff is scheduled for 10:30pm EST.
UNLV is a betting favorite in Week 13, with the spread sitting at -3 (-105).
The Hawaii vs. UNLV Over/Under is 64.5 total points.
Bet now on UNLV vs Hawaii & all NCAAF games with BetMGM
Hawaii vs. UNLV Odds, Spread, Over/Under:
| Spread | Total (O/U) | Moneyline | |
| Hawaii | +3 -115 | 64.5 -110 | 120 |
| UNLV | -3 -105 | 64.5 -110 | -145 |
Hawaii vs UNLV Prediction:
The winning team model predicts UNLV will win this game with 57.6% confidence, based on game simulations, offensive & defensive matchups and recent game results.
This winning team prediction factors in up-to-date player injuries for both Hawaii and UNLV, key player performances this season and recent team trends.
Hawaii vs UNLV Spread Prediction:
Based on recent against-the-spread trends, the model predicts Hawai'i will cover the spread with 50.6% confidence.
This prediction against the spread factors in ATS performances for both teams, opening and current betting lines plus public and sharp money already wagered on this matchup.
Bet now on UNLV vs Hawaii and all games with BetMGM
Hawaii Best Bets Today
- Hawaii has hit the 1H Moneyline in 9 of their last 11 games (+8.55 Units / 9% ROI)
- Hawaii has hit the Moneyline in 7 of their last 10 games (+7.25 Units / 61% ROI)
- Hawaii have covered the 1Q Spread in 9 of their last 11 games (+6.96 Units / 52% ROI)
- Hawaii has hit the Team Total Over in their last 5 games (+5.00 Units / 87% ROI)
- Hawaii have covered the Spread in 8 of their last 11 games (+4.70 Units / 39% ROI)
UNLV Best Bets Today
- UNLV has hit the Moneyline in 11 of their last 14 games (+7.45 Units / 13% ROI)
- UNLV has hit the Team Total Over in 8 of their last 9 games (+6.85 Units / 64% ROI)
- UNLV has hit the Game Total Under in 9 of their last 14 games (+3.50 Units / 23% ROI)
- UNLV has hit the 1H Game Total Over in 9 of their last 14 games (+3.20 Units / 20% ROI)
- UNLV have covered the Spread in 8 of their last 14 games (+1.40 Units / 9% ROI)
Hawaii Against the Spread (ATS) Record
Hawaii is 7-3 against the spread this college football season (+3.7 Units / 33.79% ROI).
- Hawaii is 6-3 when betting on the Moneyline for +5.3 Units / 48.62% ROI
- Hawaii is 4-6 when betting the Over for -2.6 Units / -23.64% ROI
- Hawaii is 6-4 when betting the Under for +1.6 Units / 14.55% ROI
UNLV Against the Spread (ATS) Record
UNLV iss 5-5 against the spread this college football season (-0.5 Units / -4.55% ROI).
- UNLV is 8-2 when betting on the Moneyline for +5.45 Units / 12.04% ROI
- UNLV is 5-5 when betting the Over for -0.5 Units / -4.55% ROI
- UNLV is 5-5 when betting the Under for -0.5 Units / -4.55% ROI
Hawaii: Keys to the Game vs. UNLV
Hawai’i opponents has averaged 7.2 Passing Attempts per TD (29 Pass Attempts/4 Passing TDs) in the Red Zone this season– T-2nd-best among Non-Power Conference Teams; Average: 3.7
Hawai’i has tackled opponents for a loss on just 4 of 58 rushing attempts (7% TFL%) in the Red Zone this season– 3rd-worst among Non-Power Conference Teams; Average: 14%.
Hawai’i has tackled opponents for a loss on just 4 of 58 rushing attempts (7% TFL%) in the Red Zone this season– 8th-worst in FBS; Average: 14%.
Hawai’i has allowed 9.1 yards from scrimmage per touch (210 yards / 23 touches) on 3rd and short this season– T-4th-worst in FBS; Average: 5.1
Hawai’i has allowed a Completion Pct of just 39% (17 completions/44 attempts) on 3rd and long this season– 4th-best in FBS; Average: 55%
UNLV: Keys to the Game vs. Hawaii
Hawai’i was 2-6 (.250) when not forcing and recovering a fumble last season– T-14th-worst among Non-Power Conference Teams; Average: .424
Hawai’i was 2-6 (.250) when their opponent rushed more than 30 times last season– T-33rd-worst in FBS; Average: .442
Hawai’i was 4-1 (.800) when allowing less than 3 sacks last season– 10th-best among Non-Power Conference Teams; Average: .583
Hawai’i is 4-1 (.800) when allowing less than 50% of third down conversion opportunities this season– T-25th-best in FBS; Average: .611
Matchup Notes for Hawaii vs. UNLV
Hawai’i was 2-6 (.250) when not forcing and recovering a fumble last season– T-14th-worst among Non-Power Conference Teams; Average: .424
Hawai’i was 2-6 (.250) when their opponent rushed more than 30 times last season– T-33rd-worst in FBS; Average: .442
Hawai’i was 4-1 (.800) when allowing less than 3 sacks last season– 10th-best among Non-Power Conference Teams; Average: .583
Hawai’i is 4-1 (.800) when allowing less than 50% of third down conversion opportunities this season– T-25th-best in FBS; Average: .611
Hawai’i opponents has averaged 7.2 Passing Attempts per TD (29 Pass Attempts/4 Passing TDs) in the Red Zone this season– T-2nd-best among Non-Power Conference Teams; Average: 3.7
Hawai’i has tackled opponents for a loss on just 4 of 58 rushing attempts (7% TFL%) in the Red Zone this season– 3rd-worst among Non-Power Conference Teams; Average: 14%.
Hawai’i has tackled opponents for a loss on just 4 of 58 rushing attempts (7% TFL%) in the Red Zone this season– 8th-worst in FBS; Average: 14%.
Hawai’i has allowed 9.1 yards from scrimmage per touch (210 yards / 23 touches) on 3rd and short this season– T-4th-worst in FBS; Average: 5.1
Hawai’i has allowed a Completion Pct of just 39% (17 completions/44 attempts) on 3rd and long this season– 4th-best in FBS; Average: 55%
Hawaii Offensive Stats & Trends
Hawai’i opponents has averaged 7.2 Passing Attempts per TD (29 Pass Attempts/4 Passing TDs) in the Red Zone this season– T-2nd-best among Non-Power Conference Teams; Average: 3.7
Hawai’i has tackled opponents for a loss on just 4 of 58 rushing attempts (7% TFL%) in the Red Zone this season– 3rd-worst among Non-Power Conference Teams; Average: 14%.
Hawai’i has tackled opponents for a loss on just 4 of 58 rushing attempts (7% TFL%) in the Red Zone this season– 8th-worst in FBS; Average: 14%.
Hawai’i has allowed 9.1 yards from scrimmage per touch (210 yards / 23 touches) on 3rd and short this season– T-4th-worst in FBS; Average: 5.1
Hawai’i has allowed a Completion Pct of just 39% (17 completions/44 attempts) on 3rd and long this season– 4th-best in FBS; Average: 55%
UNLV Offensive Stats & Trends
Hawai’i was 2-6 (.250) when not forcing and recovering a fumble last season– T-14th-worst among Non-Power Conference Teams; Average: .424
Hawai’i was 2-6 (.250) when their opponent rushed more than 30 times last season– T-33rd-worst in FBS; Average: .442
Hawai’i was 4-1 (.800) when allowing less than 3 sacks last season– 10th-best among Non-Power Conference Teams; Average: .583
Hawai’i is 4-1 (.800) when allowing less than 50% of third down conversion opportunities this season– T-25th-best in FBS; Average: .611
Hawaii Defensive Stats & Trends
Hawai’i opponents has averaged 7.2 Passing Attempts per TD (29 Pass Attempts/4 Passing TDs) in the Red Zone this season– T-2nd-best among Non-Power Conference Teams; Average: 3.7
Hawai’i has tackled opponents for a loss on just 4 of 58 rushing attempts (7% TFL%) in the Red Zone this season– 3rd-worst among Non-Power Conference Teams; Average: 14%.
Hawai’i has tackled opponents for a loss on just 4 of 58 rushing attempts (7% TFL%) in the Red Zone this season– 8th-worst in FBS; Average: 14%.
Hawai’i has allowed 9.1 yards from scrimmage per touch (210 yards / 23 touches) on 3rd and short this season– T-4th-worst in FBS; Average: 5.1
Hawai’i has allowed a Completion Pct of just 39% (17 completions/44 attempts) on 3rd and long this season– 4th-best in FBS; Average: 55%
UNLV Defensive Stats & Trends
Hawai’i was 2-6 (.250) when not forcing and recovering a fumble last season– T-14th-worst among Non-Power Conference Teams; Average: .424
Hawai’i was 2-6 (.250) when their opponent rushed more than 30 times last season– T-33rd-worst in FBS; Average: .442
Hawai’i was 4-1 (.800) when allowing less than 3 sacks last season– 10th-best among Non-Power Conference Teams; Average: .583
Hawai’i is 4-1 (.800) when allowing less than 50% of third down conversion opportunities this season– T-25th-best in FBS; Average: .611
Bet now on UNLV vs Hawaii and all games with BetMGM
More College Football Betting at BetMGM
BetMGM is the best online sportsbook for college football betting.
Whether you’re a first-time bettor checking out the best sportsbook promos, a casual fan betting on Georgia football national championship odds, Michigan football odds, or Ohio State playoff odds, or a longtime diehard breaking down trends for live sports betting, there are entertainment options for everyone.
Visit the sportsbook today to place a college football bet online!
The content provided in this blog is intended for entertainment purposes only. All views and opinions expressed are the authors and reflect their individual perspectives on sports, betting, and related topics. This content should not be considered professional betting advice or the official views of BetMGM LLC. Please gamble responsibly. If you or someone you know is experiencing issues related to gambling, seek help from a licensed health professional. This blog is not liable for any losses, damages, or consequences resulting from betting activities.